CFO Executive Cockpit
Financial Performance. Manage Risk. Maximize Value.
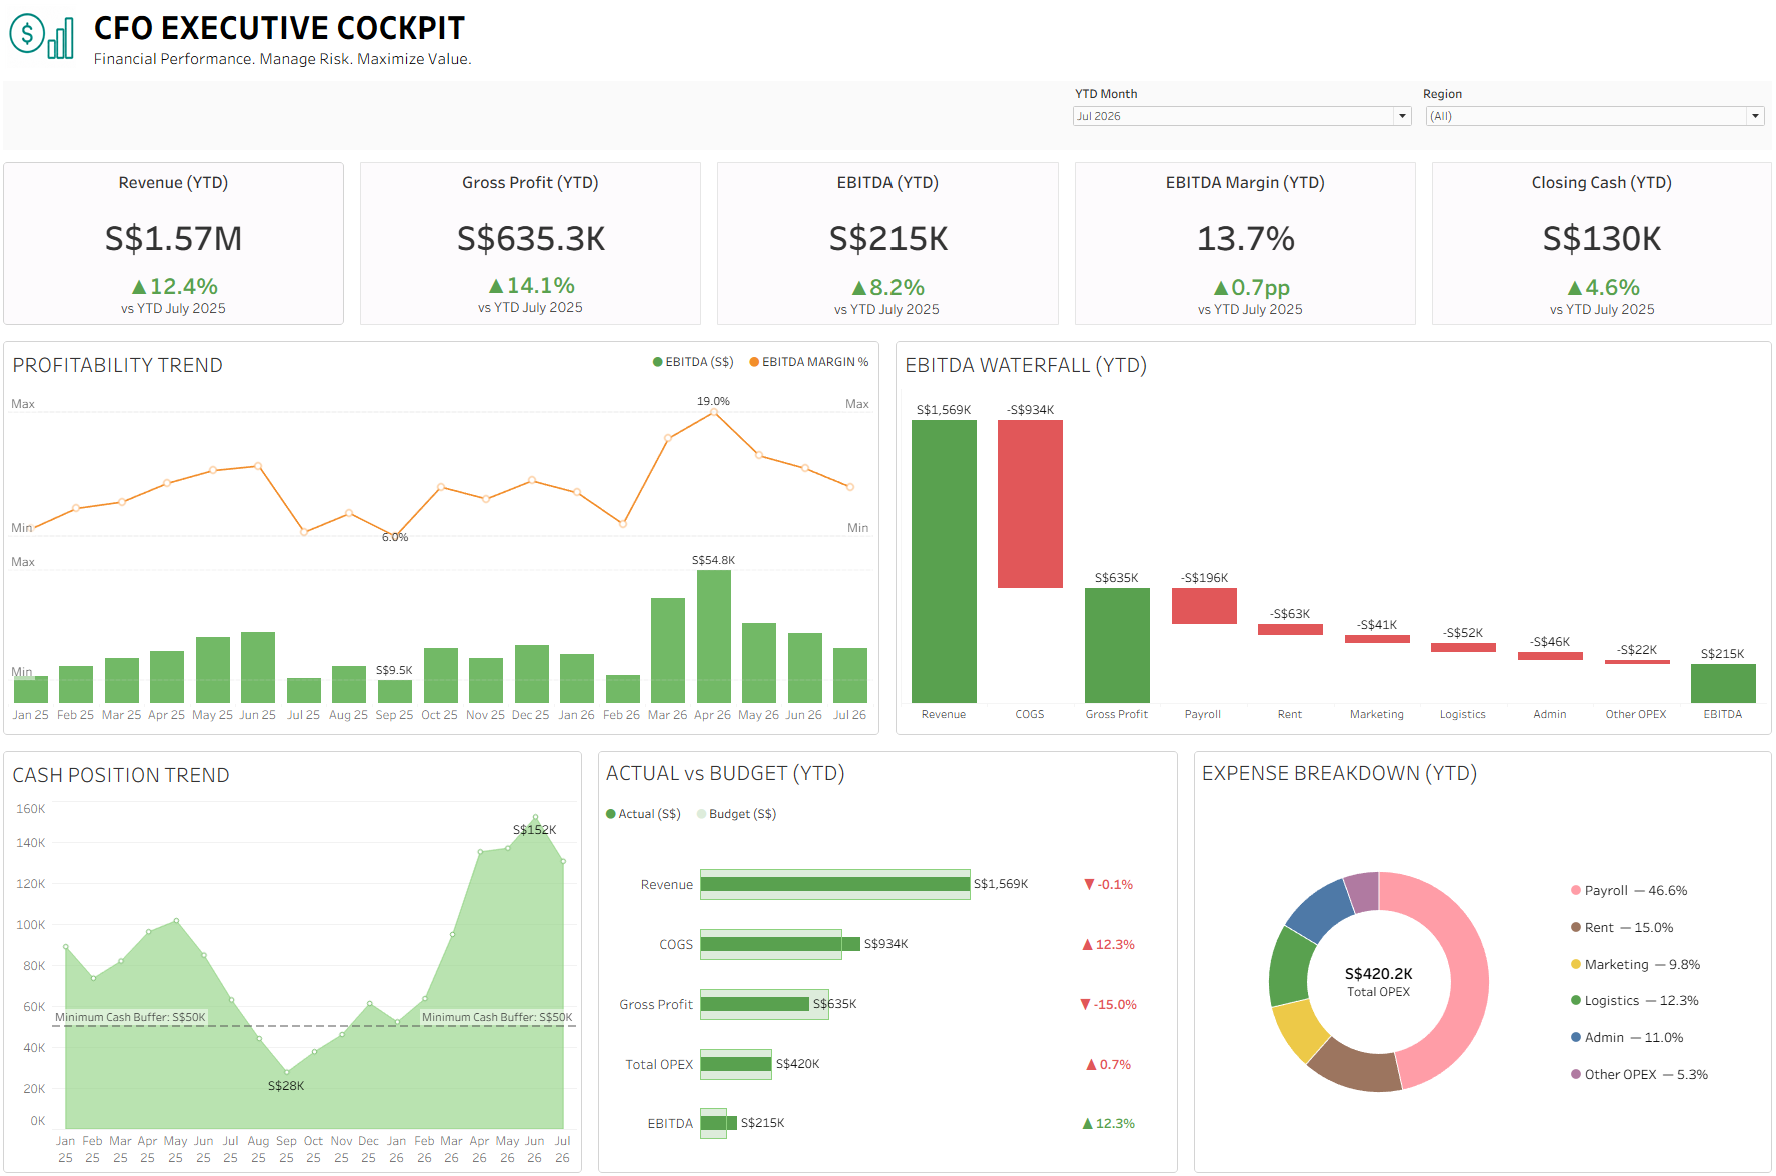
Bring profitability, budget performance, cost drivers and liquidity into one executive view — giving management a clear line of sight from revenue growth to cash generation.
The CFO Executive Cockpit transforms financial and operational data into decision-ready insights, helping management understand not only what happened, but why it happened and where attention is required.

The Business Challenge
As businesses grow, financial information often becomes fragmented across accounting systems, sales records, budgets and spreadsheets.
Management may know the headline revenue or profit number, but answering the questions behind those numbers can be difficult:
- Are we growing profitably?
- Are we performing according to plan?
- What is driving changes in margin and EBITDA?
- Where are operating costs increasing?
- Do we have sufficient liquidity to support the business?
Traditional financial reporting can explain historical results, but management needs a more connected view of performance, profitability, cost and cash to make timely decisions.
The Analytics Solution
The CFO Executive Cockpit consolidates sales, financial, budget, operating expense and cash data into a unified management analytics layer.
Rather than viewing financial metrics independently, the dashboard connects the financial story from:
Revenue → Gross Profit → Operating Expenses → EBITDA → Cash
This gives management a consistent view of financial performance while allowing attention to quickly shift toward material budget variances, cost pressures and liquidity risks.
What the Dashboard Answers
PROFITABILITY
Are we converting growth into sustainable earnings?
- Revenue
- Gross Profit
- Gross Margin
- EBITDA
- EBITDA Margin
- Profitability Trend
Understand whether revenue growth is translating into stronger operating profitability.
PERFORMANCE TO PLAN
Are financial results tracking against management expectations?
- Actual vs Budget
- Revenue
- COGS
- Gross Profit
- OPEX
- EBITDA
Identify material favorable and unfavorable variances requiring management attention.
COST CONTROL
Where is profitability being gained or lost?
- EBITDA Waterfall
- COGS
- Payroll
- Rent
- Logistics
- Marketing
- Other OPEX
Understand the composition of the cost base and its impact on EBITDA.
LIQUIDITY
Does the business have sufficient financial headroom?
- Closing Cash
- Monthly Cash Trend
- Minimum Cash Buffer
Identify periods where liquidity may require management attention.
From Revenue to EBITDA
One of the central views in the CFO Executive Cockpit is the EBITDA waterfall. It provides management with a transparent bridge from revenue to operating profitability:
Revenue → COGS → Gross Profit → Operating Expenses → EBITDA
Rather than showing EBITDA as an isolated KPI, the waterfall makes the drivers of profitability visible. Management can see how revenue is converted into gross profit, where operating resources are being consumed, and ultimately how much operating profit remains.
From Budget Variance to Management Action
Budget reporting becomes more useful when variance highlights where management attention is required.
The dashboard therefore distinguishes between favorable and unfavorable movements based on the financial nature of each metric.
- Revenue below budget → requires attention
- COGS above budget → requires attention
- Gross Profit below budget → requires attention
- OPEX above budget → requires attention
- EBITDA above budget → favorable
This allows the dashboard to function as an exception-management tool, rather than simply presenting actual and budget numbers side by side.
Key Management Insights
PROFITABILITY
Understand the quality of earnings
Track whether revenue growth is translating into Gross Profit and EBITDA, while monitoring margin trends for early indications of profitability pressure.
COST DISCIPLINE
Identify where profitability is being diluted
Separate COGS from operating expenses and break OPEX into meaningful categories to understand which costs are having the greatest impact on profitability.
LIQUIDITY
Maintain sufficient financial headroom
Monitor closing cash and its movement against a defined minimum cash buffer to identify periods of potential liquidity pressure.
The Data Foundation
The CFO Executive Cockpit is powered by a structured analytics pipeline rather than direct reporting from spreadsheets.
Sales + Finance + Budget + OPEX + Cash
↓
Python Ingestion
↓
AWS RDS PostgreSQL
↓
Raw Layer
↓
Dimensional Finance Mart
↓
vw_cfo_dashboard
↓
Tableau
↓
CFO Executive Cockpit
Python · Pandas · SQLAlchemy · PostgreSQL · AWS RDS · SQL · Tableau
Financial data is transformed into a governed analytics model where revenue, COGS, gross profit, operating expenses, EBITDA, budget and cash metrics are consistently defined before being exposed to Tableau.
Financial Reconciliation Across the Analytics Model
Management reporting is only valuable when the numbers can be trusted.
Sales Revenue ↔ Finance Revenue
Ensures reported revenue is consistent with underlying sales transactions.
Sales COGS ↔ Finance COGS
Maintains consistency between commercial margin analysis and financial reporting.
Itemized OPEX ↔ Total OPEX
Ensures detailed expense categories reconcile to consolidated operating expenses.
Gross Profit − OPEX ↔ EBITDA
Validates the relationship between operating performance and reported EBITDA.
This creates a consistent financial foundation across management dashboards and reduces the risk of conflicting KPI definitions.
From Financial Reporting to Financial Decision Support
The CFO Executive Cockpit moves beyond presenting historical financial results. It connects profitability, budget performance, cost structure and liquidity into a single management view—helping leaders identify exceptions, understand financial drivers and focus attention where action is required.
One governed data foundation. One financial story. Better management decisions.
See the Sales Perspective
Explore how the same analytics foundation supports performance, customer, product and sales execution.
Ready to Build a Better Analytics Foundation?
Turn existing sales, finance and operational data into a governed cloud analytics platform with decision-ready management dashboards.
Portfolio demonstration: This solution uses synthetic demonstration data designed to represent a realistic SME sales and financial environment.